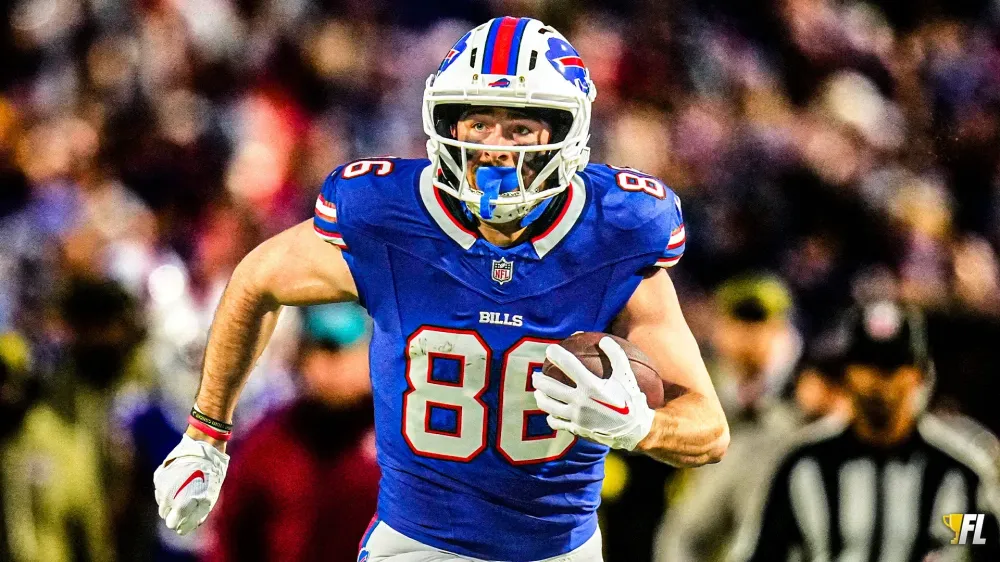
NFL Scoring Down? How To Counter Offensive Decline In Fantasy Football
John Laghezza performs a deep dive into the factors that have gone into the decline in NFL scoring, and how it's impacting fantasy football.
Great to be back. Let’s try a little fantasy exercise to kick things off the right way. Select any podcast or article in your bookmarked feed. I’ll guarantee it won’t be long before hearing some mention of a scoring decline, pushing drafters back toward the RB-heavy starts of yesteryear.
Before pouncing on the wisdom of the talking heads and social media crowd, it might make sense to look before we leap. So join me on an exploration through visualization of the last decade of NFL metadata to see if the assertion is even valid—and how we should be treating this new offensive dynamic in our drafts going forward.

Join Our Newsletter
Trusted by 400,000+ fantasy football players. Get access to Fantasy Life's free award winning newsletter and tools, all in one step.
By registering or logging in, you agree to our Terms of Use and Privacy Policy.
How NFL Scoring Decline Has Impacted Fantasy Football
Fantasy Points Scored
Like a moth to the fantasy flame, my gut instinct drew me face-first into an initial roadblock. Turns out despite the narratives, leaguewide scoring’s remained mostly flat, while oscillating in a rectangular pattern for the last decade (never below 21.8 PPG or above 24.0 PPG).
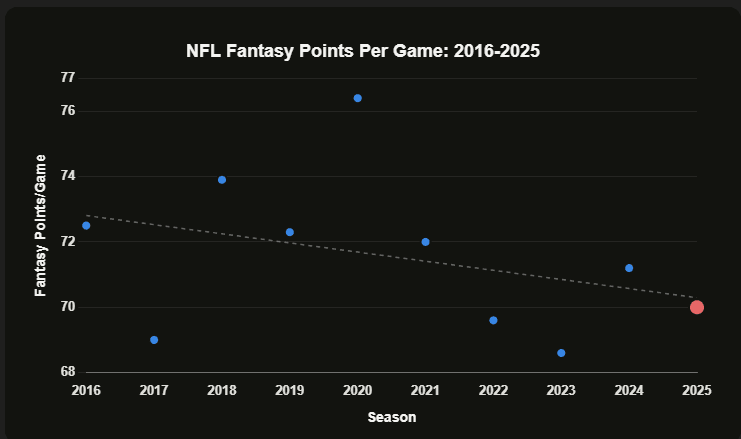
And though that seemed like a fine place to start, a second thought inspired mining actual fantasy points scored to smooth out some variance and get closer to the mark. Turns out things are undeniably heading south in terms of fantasy points scored (image below).
We may be slightly off the bottom, but registering fewer than 70 total fantasy points per game in three of the NFL’s last four seasons isn’t pretty. Chalk up a win for the wisdom of the crowd.
Plays Per Game
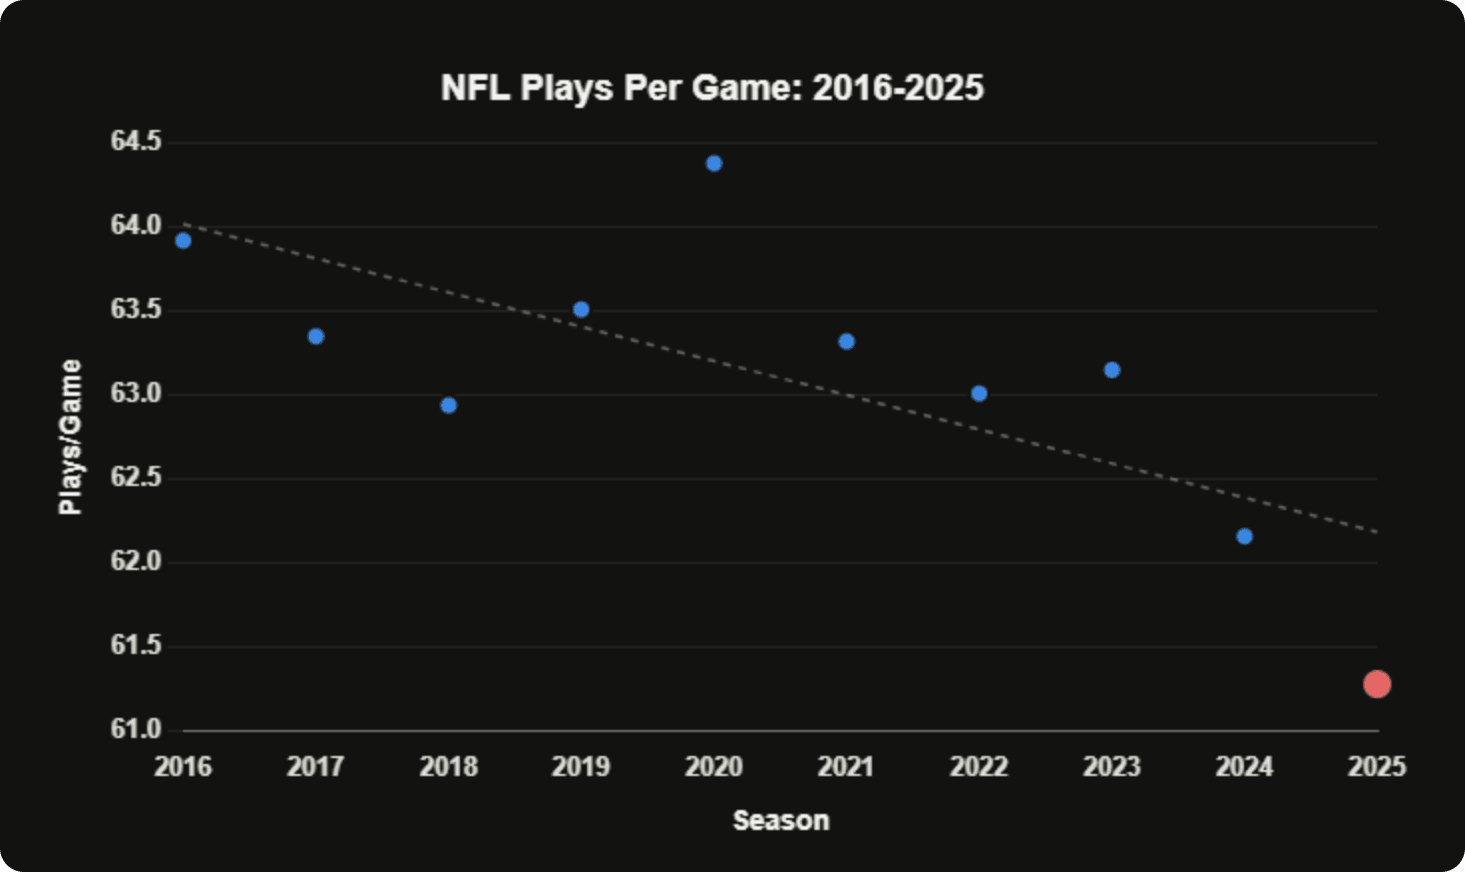
Since fantasy’s a game built directly on a foundation of opportunity, volume intuitively rose to the fore as a potential culprit. And what do you know? Play volume on a per game basis didn’t just sink below 62 for the first time in 18 years, it’s easily the lowest in Trumedia’s 26-year database. Oof. Shoutout the haters.
There’s no hiding from it. Fewer plays run equals less scoring on the board—and though overly simplistic on its face, it’s still true.
Yards Per Game
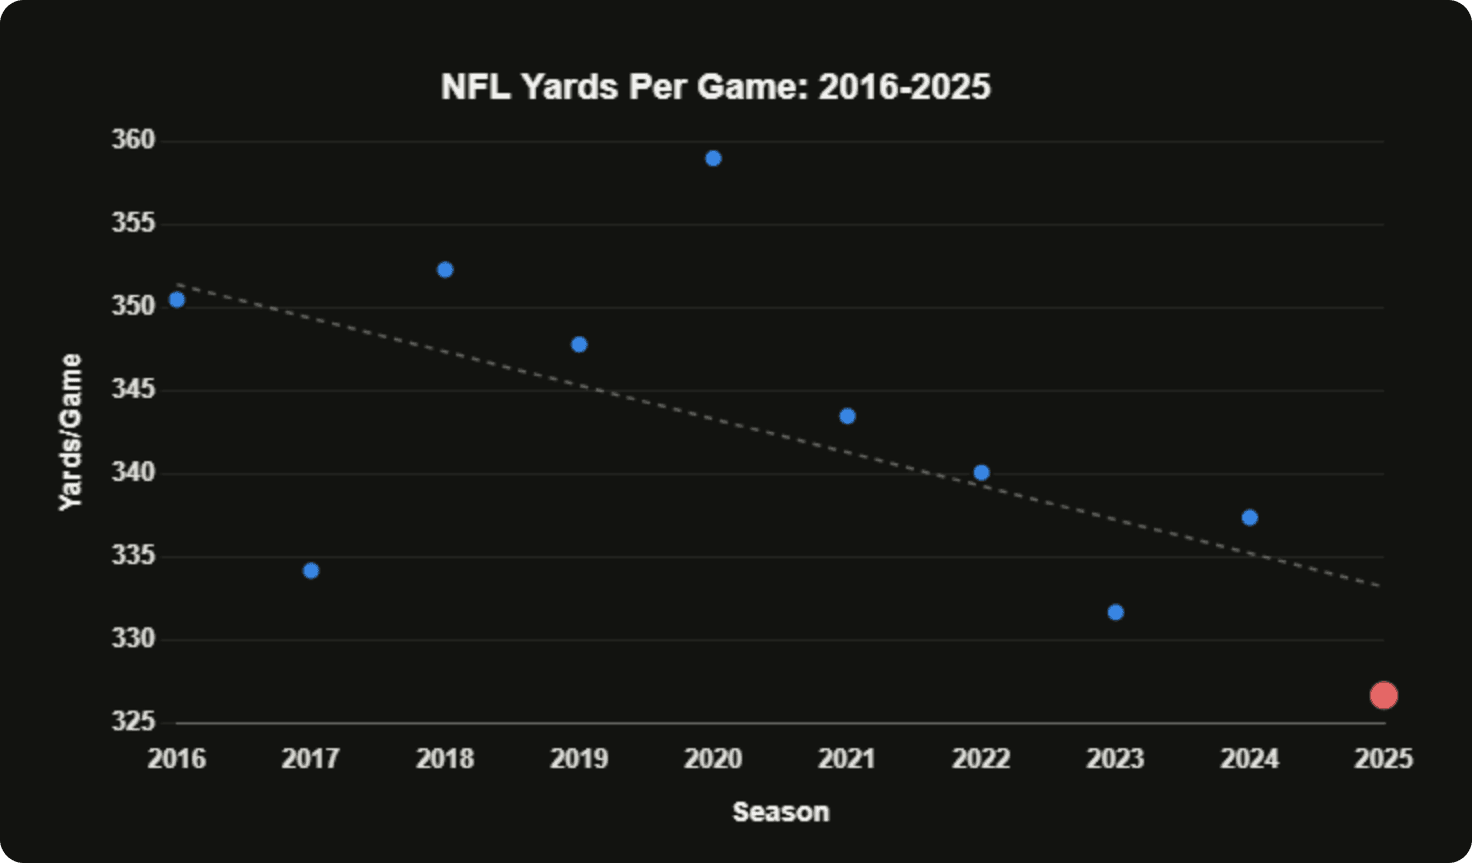
Making determinations based solely on volume misses the obvious nuance of explosivity. Well, upon further review you may want to avert your eyes—2025’s 326.6 yards per game is also the lowest we’ve seen in 18 years. That's nearly 5% less than the average in that same timespan. Yikes.
Ok, Ok, don’t panic. Volume’s down as well as efficiency … so what’s going on here?
Rush Rate
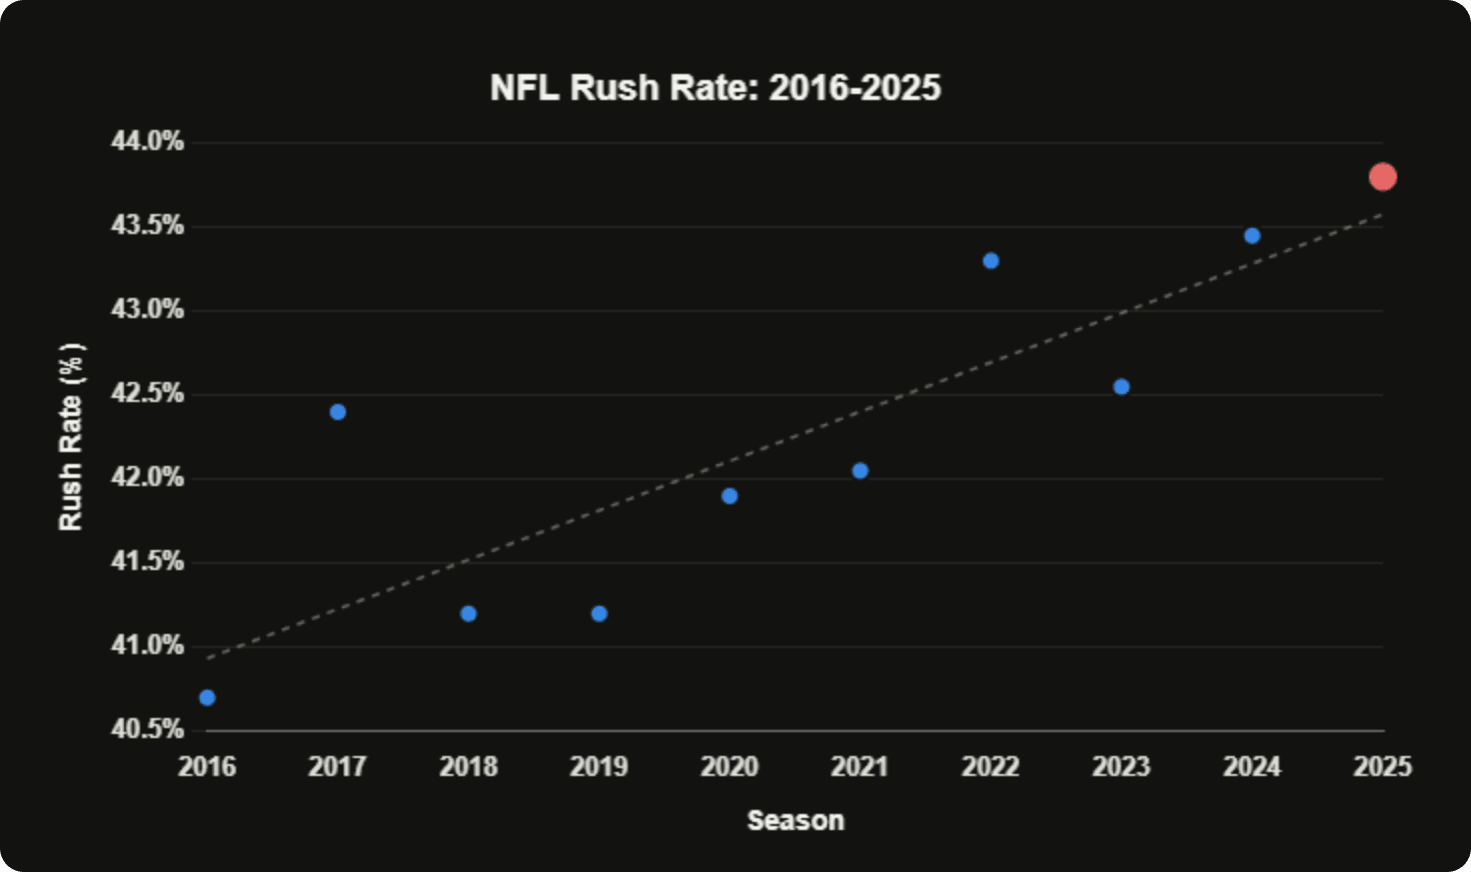
Play volume nosediving without subsequent yardage or fantasy point returns could really only mean one thing—NFL teams must be running the ball at an elevated rate. Once again, 2008 marks the last time we’ve seen ground attacks deployed with this frequency (43.8%). Doesn’t take a JP Morgan technical analyst to point out the ascending channel in our chart below.
No matter how you slice it, gaining between the tackles is back en vogue.
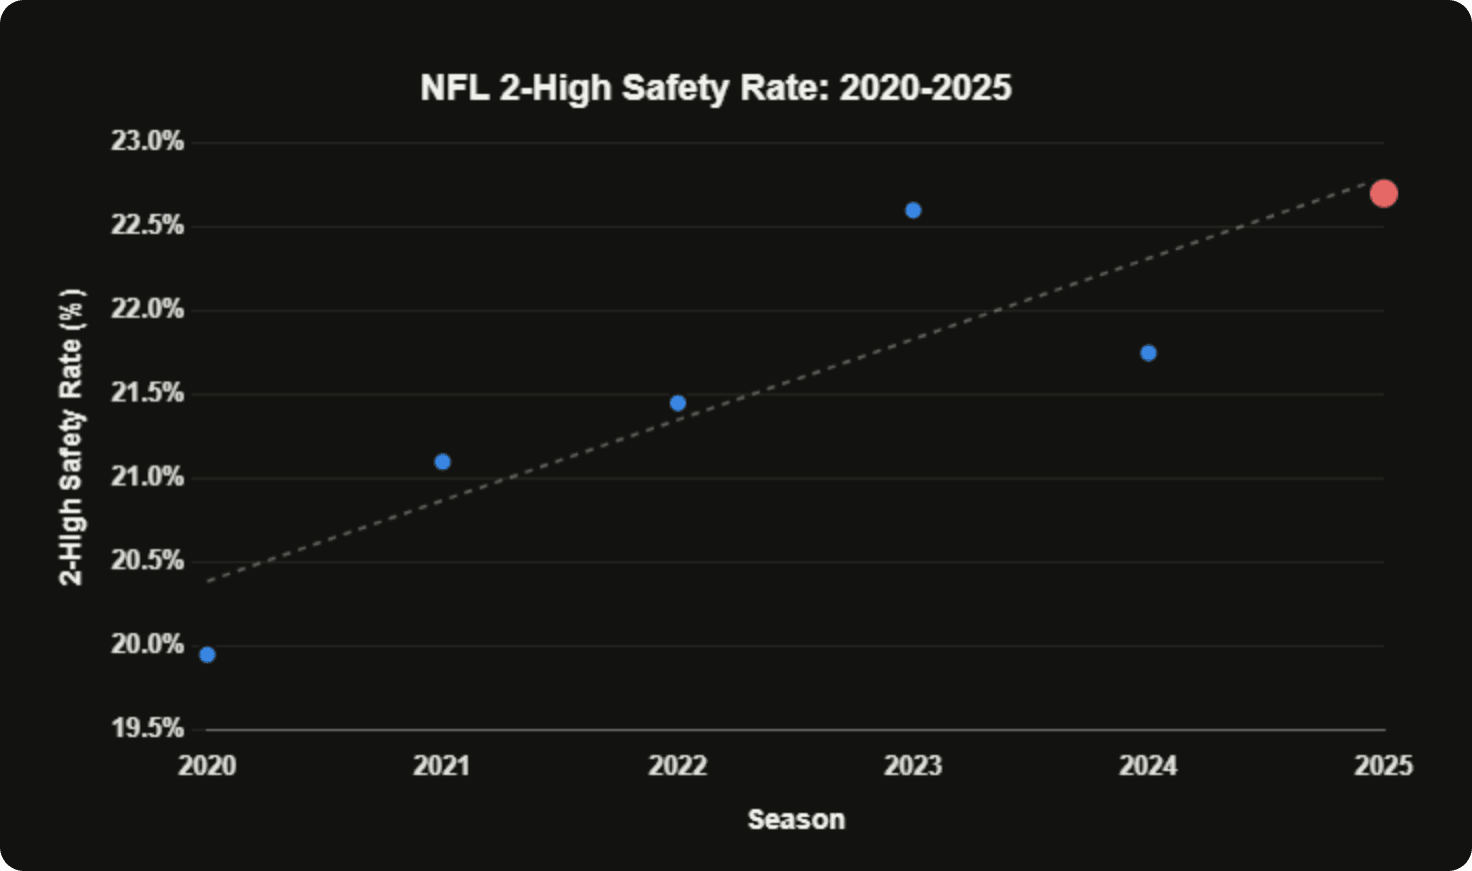
Next question rests with the obvious matter of why. Though difficult to quantify objectively, the simplest answer is often closest to the mark. We’ve all heard the tropes about preventive defenses (namely two-high safety looks) stunting explosives leaguewide. Well, you can’t blame coordinators for figuring out it’s worth allowing extended drives to prevent long touchdowns. Remember, every play runs an independent risk of failure via turnovers.
2-High Safeties
Just as we suspected … Two-high safety formations continue asserting prevalence across what we already know to be a copycat league. Great. The observed sample’s a bit shorter in this case (zone data began in 2020)—but it feels pretty safe to say the trend’s here to stay, so long as it’s doing its job.
Air Yards Per Target
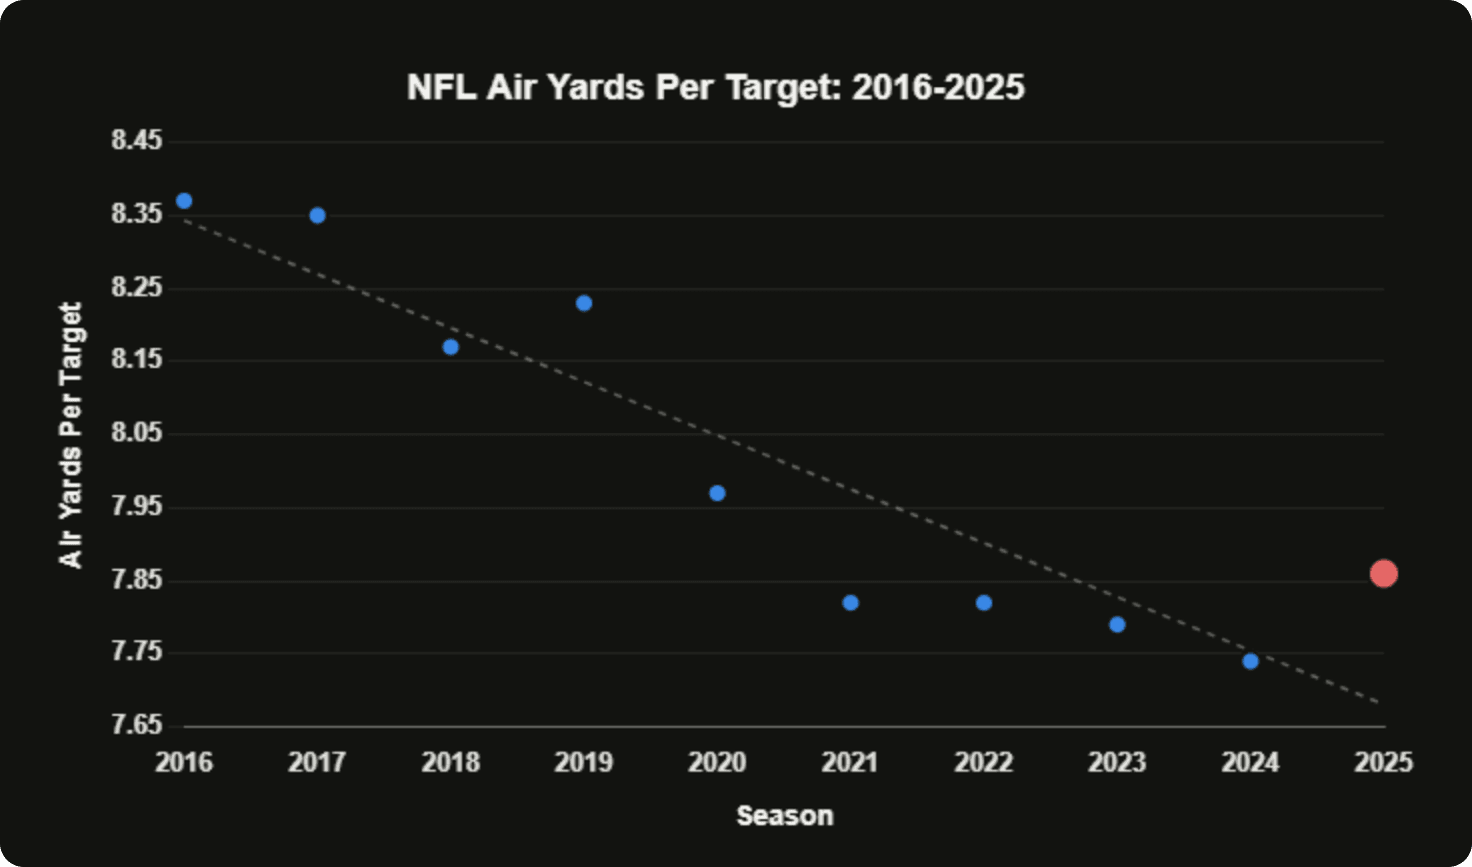
Suddenly dawned on me perhaps fewer dropbacks meant deeper targets, if and when quarterbacks are successful in drawing defenses up closer to the line. Swing and a miss on that one. And not even close to be honest.
Staying in our trend of not-so-fantasy-friendly environments, there’s yet another incontrovertible multi-decade trend heading in the wrong direction. Target depth data goes back 20 years and doesn’t bode well whatsoever for receivers. Leaguewide ADoT spent its first 14 years firmly above the 8.0 mark, until 2020 when it finally touched 7.9, and never looked back once.
Tight End Target Rate
Determined to uncover at least one nugget of fantasy goodness to share, a lightbulb upstairs (though dim) finally does go off …
So I ask myself (SELF?!) which pass catchers could and should be more involved in more run-heavy, low-target-depth situations?
The answer was under our noses all along. Tight ends, Eureka!
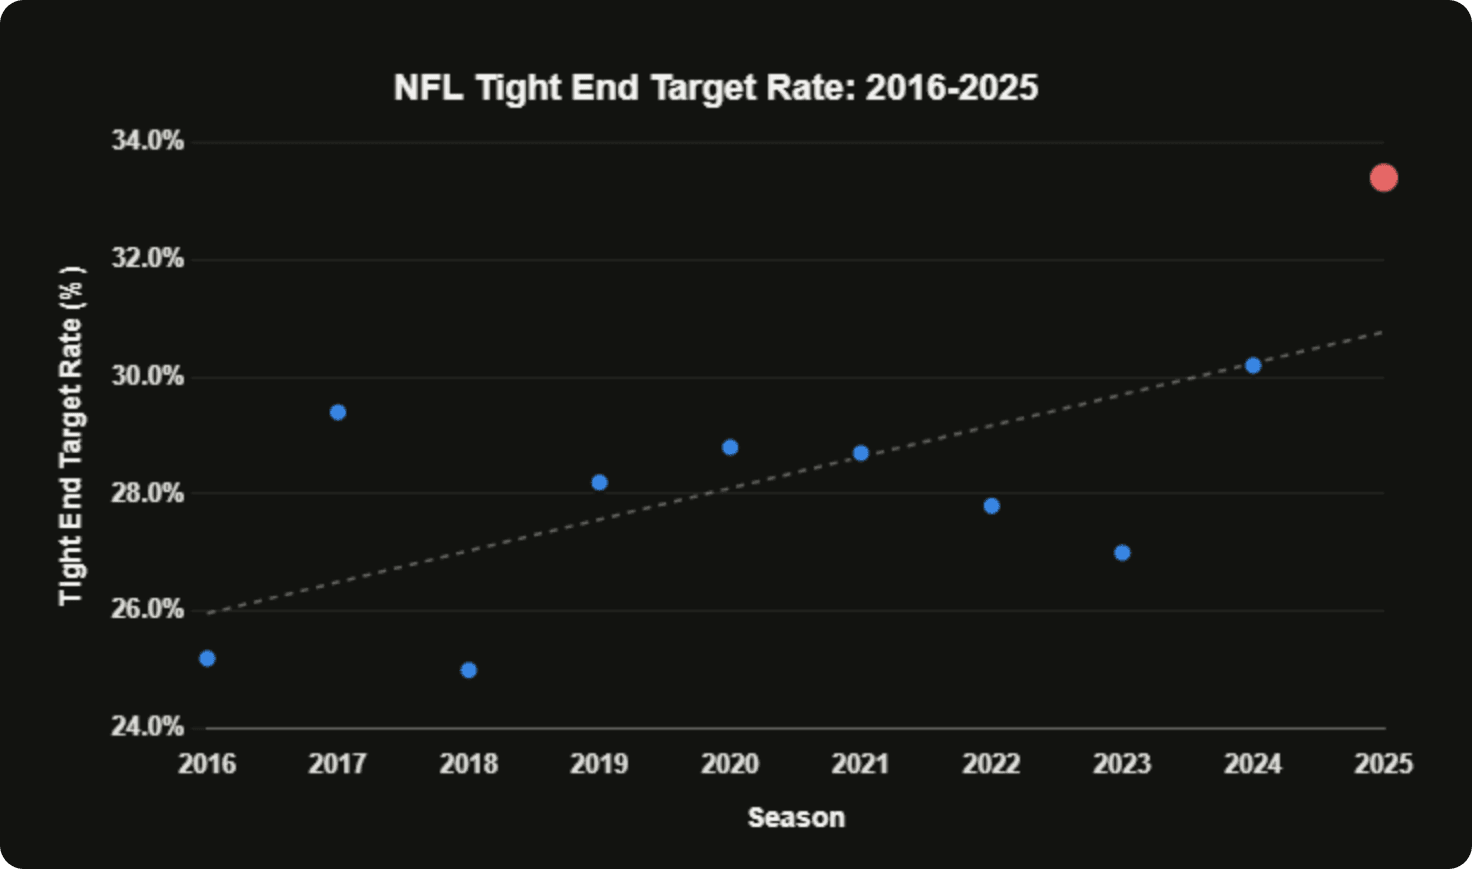
And what do you know? Another all-time high, except this time it’s the percentage of total targets being funneled through big men rather than out wide. Again, it’s clear as day we’re experiencing a fantasy sea change.
Suddenly, the gap in middle-round wide receiver production everyone’s complaining about feels significantly more real than it did yesterday.
Fantasy Strategy for Countering the Scoring Declilne
My answer’s fairly apparent, if you can stomach the shame of championing a square peg into a round hole. Not sure these words have ever been spoken but here goes nothing—it’s time to consider starting a TE in your FLEX spot (ducks).
Fact is, it isn’t that crazy from a projections standpoint …
Take wideout Ricky Pearsall for example: currently the WR43 at ADP ~107, he’s projected for virtually the same amount of points as Mark Andrews, Dalton Kincaid or Dallas Goedert. All of them can be drafted at least a full round later. I’d also add each of those names rank substantially higher in their respective pecking order, increasing chances for TDs. And with the Ravens, Eagles and Bills, we’re getting exposure to the best of the best.
No point in complaining about the everchanging state of the game when you can steer directly into the boredom and just draft more tight ends! Yay!

Go FantasyLife+
Your league is unique. Your advice should be too. Get personalized tools, rankings, and projections tailored to your fantasy football league settings.
Players Mentioned in this Article








Published Updated